Instacart Grocery OnlineThe Instacart stakeholders are most interested in the variety of customers in their database along with their purchasing behaviors. This exploratory analysis looks at how we can target different customers with applicable marketing campaigns to see whether they affect the sale of their products.

-
The Instacart stakeholders are most interested in the variety of customers in their database along with their purchasing behaviors. They assume they can't target everyone using the same methods, and they’re considering a targeted marketing strategy. They want to target different customers with applicable marketing campaigns to see whether they have an effect on the sale of their products.
-
perform an initial data and exploratory analysis of some of their data to derive insights and suggest strategies for better segmentation based on the provided criteria. This analysis will inform what this strategy might look like to ensure Instacart targets the right customer profiles with the appropriate products
-
Deliver a final report including tables and visualizations that profile Instacart customers based on their purchase behaviors.
-
Peak Order Times and Spending Habits.
Price Range Grouping.
Product Popularity and Department Frequency.
Customer Segmentation and Ordering Behavior.
-
The Instacart Online Grocery Shopping Dataset 2017”, Accessed from www.instacart.com/datasets/grocery-shopping-2017 via Kaggle on [15/09/2023]
Data Management
01. Data Cleaning
Each data set was checked for data quality measures and consistency. Data was scrutinized through typical consistency checks and cleaned where necessary. Mixed-type variables, missing values, and duplicates were addressed - luckily these datasets allowed for a relatively straightforward cleaning process.
02. Merging & Segmenting Data
With the cleaned datasets, I looked at merging datasets, deriving new variables as well as grouping and aggregating the data. This was instrumental in fully being able to explore and segment the data in a manner that would make sense for Instacart customer profiles, to be used in visualisations.
03. Data Analysis
In the process of analyzing the data, the focus lay in grouping variables and applying statistical criteria. Additionally, in this phase, I delved into the objective of extracting meaningful insights about the customer profiles and their spending habits, to advise on marketing efforts.
Insights & Visualisation
Example of vizualisations
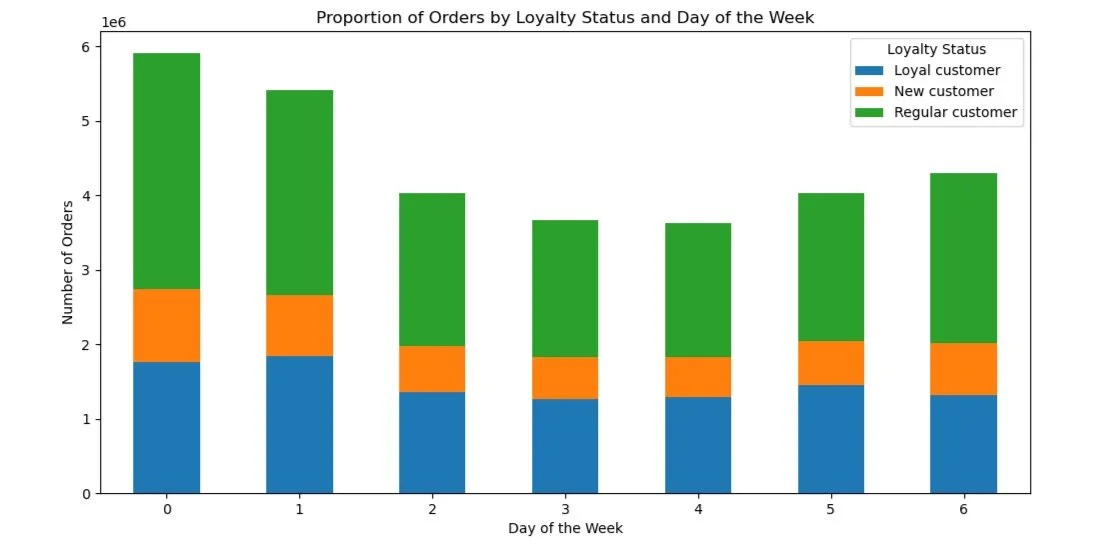
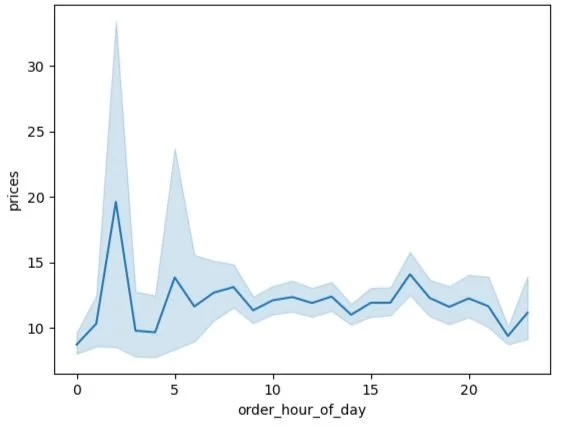
The weekends, specifically Saturday and Sunday, are the busiest days of the week for orders. Furthermore, the period from 10 am to 12 pm sees the highest order activity during the day. Interestingly, the 11 am to 12 pm time slot receives the most valuable orders in terms of cost, aligning with the busy shopping trend observed between 10 am and 12 pm.
Peak Order Times and Spending Habits
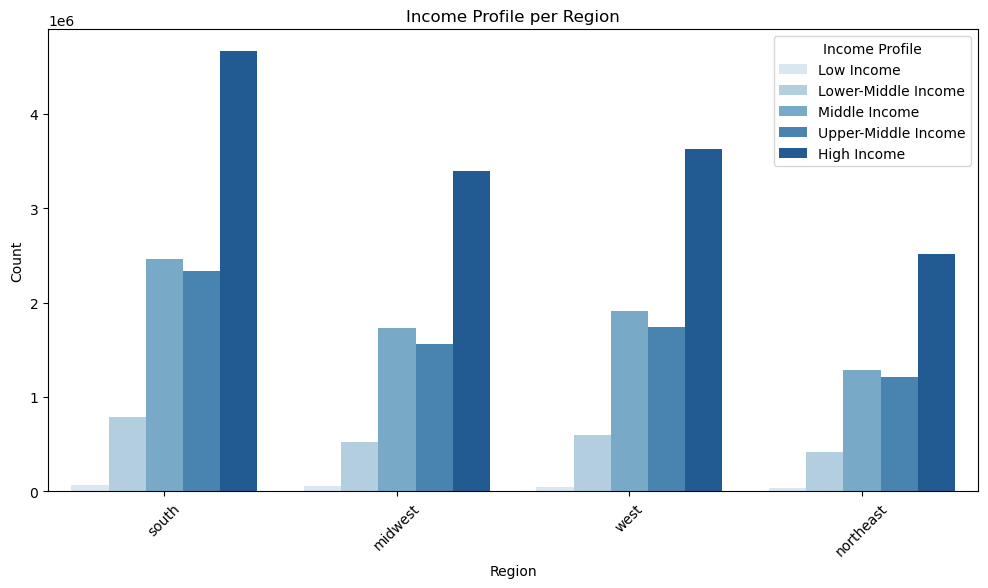
Across regions, the most popular departments and ordering days show consistent trends, but the South, with more customers, has lower average order cost and total order cost compared to the Midwest, which has fewer customers but higher average total order value, suggesting a preference for more expensive products.
Product Popularity and Department Frequency
The majority of customers are not frequent buyers, with regular customers making up around 20% of orders in each category. Health enthusiasts tend to spend the most, followed by single adults, weekend shoppers, and late-night shoppers, and the ordering patterns suggest that bulk and family shoppers are more consistent, while single adults, health enthusiasts, and weekend shoppers have more erratic ordering habits likely due to their preferences and needs.
Customer Segmentation and Ordering Behavior
Recommendations & Findings
-
Please see full suggestions of recommendations in the final report
-
To schedule ads effectively, it's advisable to target less busy days (Monday through Friday) and non-peak hours (before 10 am and after 12 pm).
Focusing on high-value products during peak spending hours (11 am to 12 pm) can enhance campaign impact. Simplified price range groupings facilitate targeted promotions.
Customer segmentation by brand loyalty and ordering habits reveals insights that can guide tailored marketing campaigns. Regional customization, recognizing the influence of age and family status, and harnessing demographic classifications are crucial to meeting diverse customer needs.
Furthermore, accommodating different customer profiles and their ordering behaviors is pivotal for building customer loyalty and driving sales growth.