World Happiness ReportThis exploratory visual analysis centers on understanding the prominent factors that contribute to happiness, including economic production, social support, life expectancy, freedom, absence of corruption, and generosity.

-
In this data analytics project, the focus lies on the World Happiness Report—an influential survey evaluating global happiness levels. Spanning the years 2013-2016, this report ranks countries based on happiness scores derived from the Cantril ladder question responses.
-
To build an interactive dashboard that will visually showcase well-curated results of an advanced exploratory analysis conducted in Python.
-
Conduct an exploratory visual analysis in Python and find connections between variables that seem worth exploring. After developing my hypotheses, I was tasked to use various advanced analytical approaches to help test my hypotheses.
The results of my analyses are to be presented in a Tableau dashboard.
-
Which socio-economic factors have the most influence on global happiness.
-
World Happiness Report 2015-2019
Data Management
01. Data Cleaning
Each data set was checked for data quality measures and consistency. Data was additionally cleaned & and transformed in order to merge relevant data sets - ready for exploration.
02. Data Exploration
With the clean & and merged datasets, I looked at exploring relationships in the data using heatmaps, scatterplots, pair plots, and categorical plots. This exploration helped me develop a hypothesis for further analysis.
03. Data Analysis
Here I sourced and cleaned geographical and time-series data associated with this analysis, performed geospatial and time-series analyses, conducted supervised and unsupervised machine learning (regression and clustering), and created an interactive Tableau dashboard with curated results for this project.
Insights & Visualisation
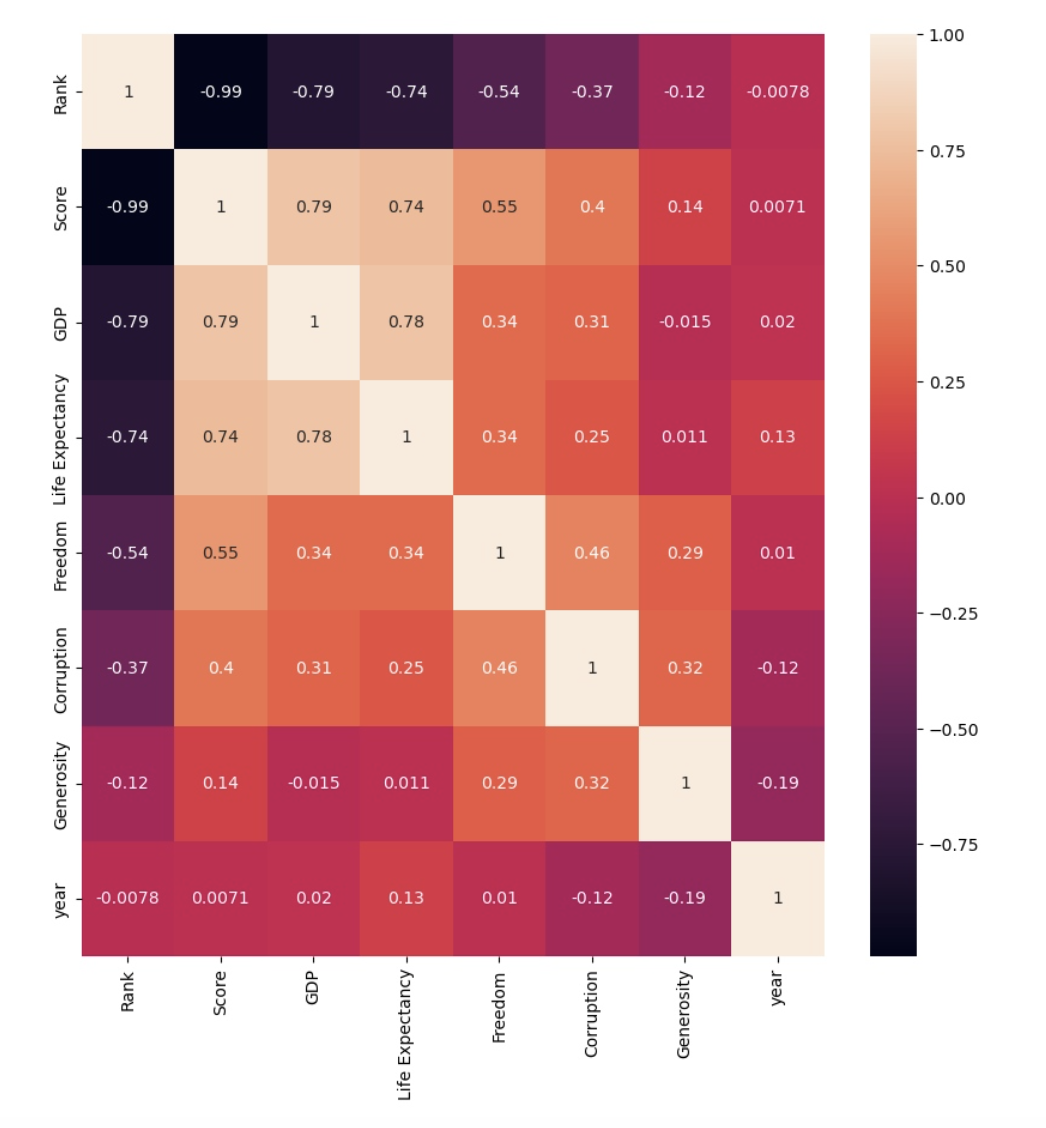
Once I created the correlation heatmap, it was anticipated that GDP and Life Expectancy would have a substantial influence on the overall happiness rank of a country.
Contrary to expectations, corruption showed a lack of significant correlation with overall happiness. While Freedom displayed a discernible trend line, its correlation was not as pronounced as anticipated when juxtaposed with the aforementioned factors.
Correlation Heat-map
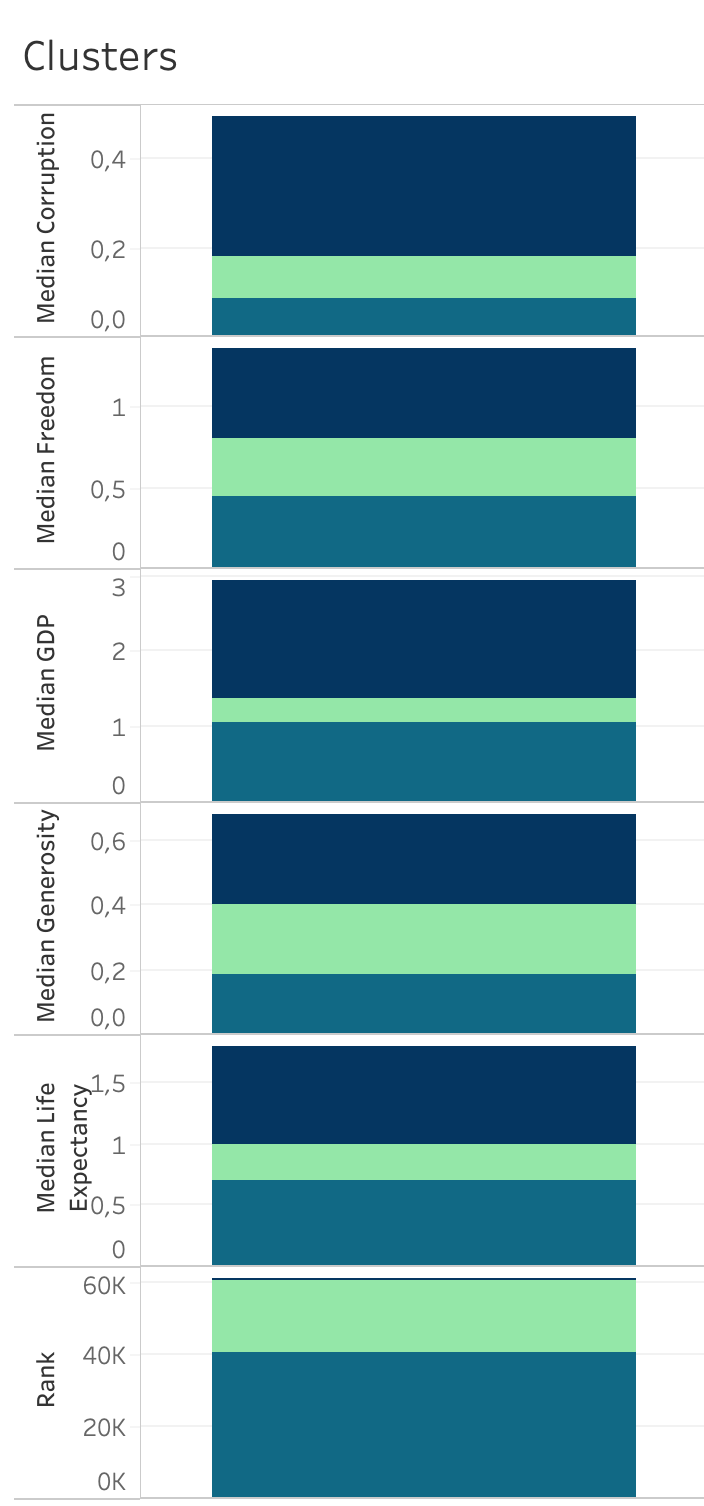
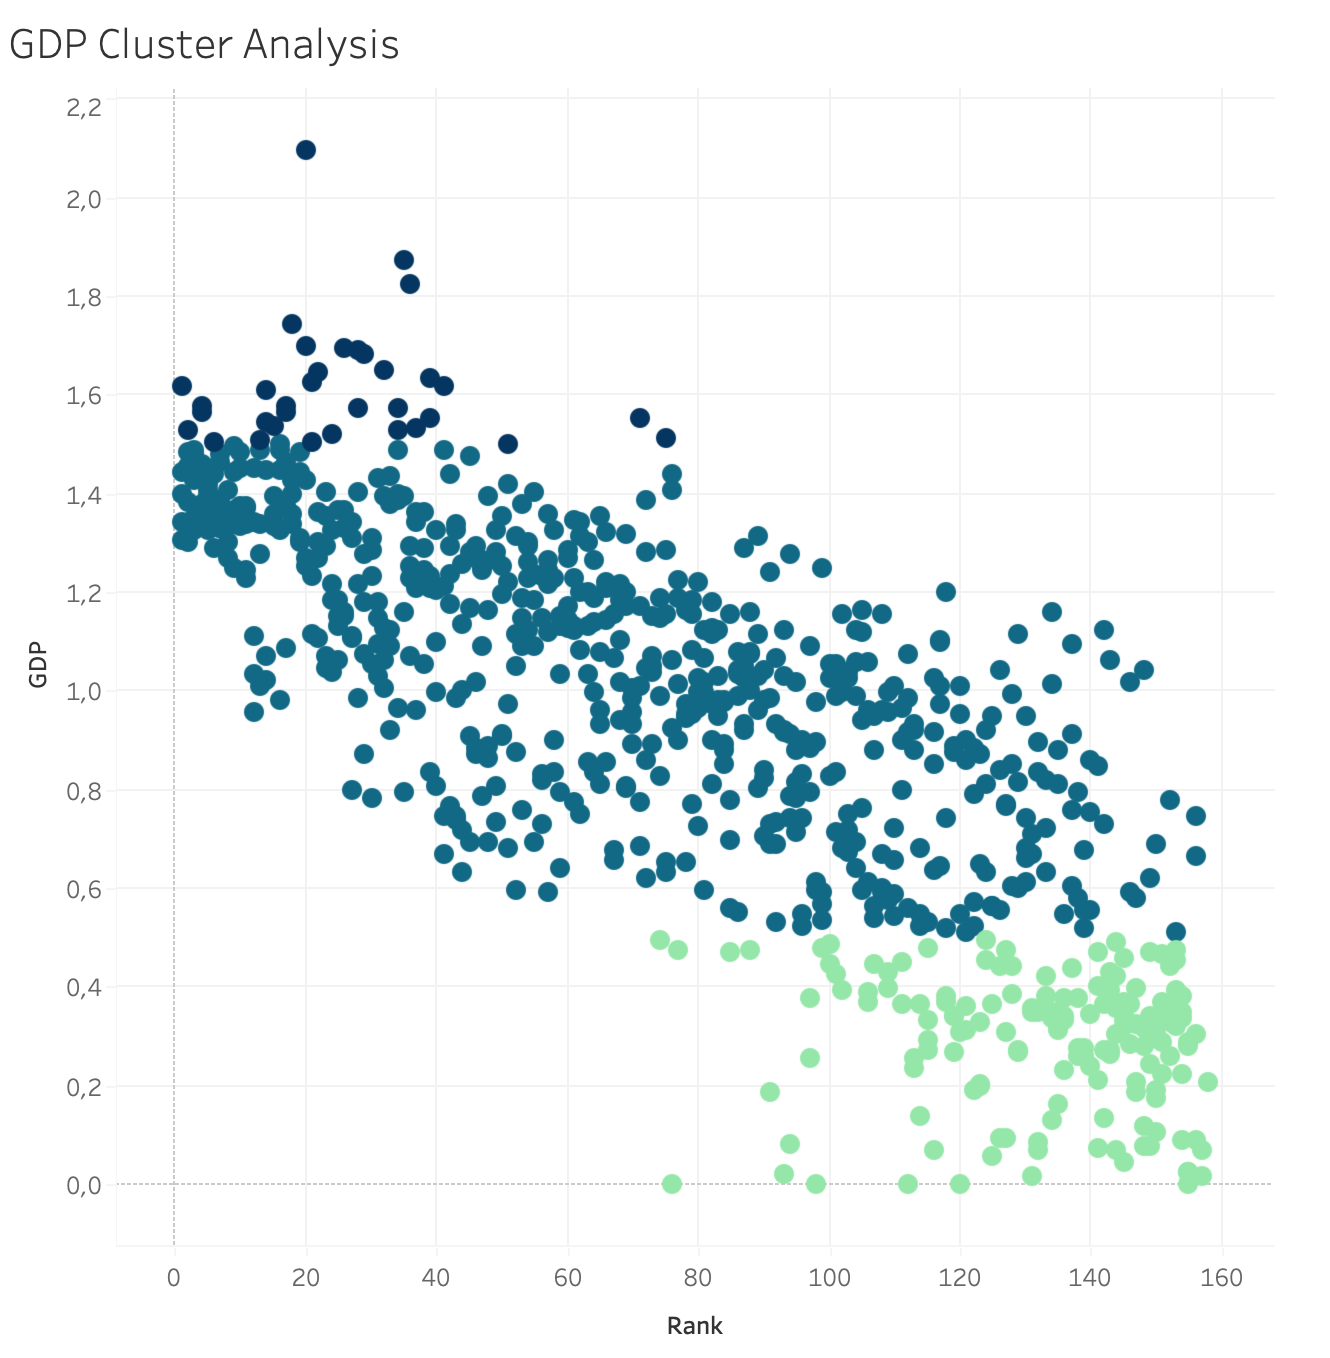
The cluster analysis reveals distinct patterns in countries based on key indicators such as GDP, Life Expectancy, Freedom, Corruption, and Generosity. The higher prosperity countries (dark blue) stand out with higher mean and median values in GDP, Life Expectancy, and Freedom, suggesting a group of prosperous nations with better quality of life and greater personal freedoms. This cluster also exhibits lower levels of corruption and moderate generosity. In contrast, 'Lower Prosperity' (green) represents countries with lower overall prosperity, life expectancy, and freedom but shows a higher level of generosity. The middle ground prosperity (blue) falls in between, portraying a middle ground with values for the mentioned indicators that lie between those of the High prosperity and Low Prosperity countries.
Cluster Analysis
Recommendations
** Please view final presentation here
-
Policy Focus: Sustain economic growth and maintain low corruption to support prosperity and quality of life.
Priority Areas: Strengthen initiatives that enhance personal freedoms and maintain moderate levels of generosity.
-
Policy Focus: Implement initiatives to improve overall well-being, focusing on economic development and increasing personal freedoms.
Priority Areas: Encourage social generosity and community support to leverage the inherent high level of generosity.
-
Policy Focus: Foster a balanced approach, addressing both economic development and social well-being.
Priority Areas: Implement measures to improve life expectancy and personal freedoms while maintaining a moderate level of generosity.