PREPARATION FOR INFLUENZA SEASONTo help a medical staffing agency that provides temporary workers to clinics and hospitals on an as-needed basis. The final results of this exploratory analysis will examine trends in influenza and how they can be used to proactively plan for staffing needs across the country.

-
The United States has an influenza season where more people than usual suffer from the flu. Hospitals and clinics need additional staff to adequately treat these extra patients. The medical staffing agency provides this temporary staff.
-
As an analyst, I was tasked to examine trends in influenza and submit recommendations as to how key stakeholders can proactively plan for staffing needs across the country for 2017.
-
Create a data story using Tableau and, present the analytical story to key stakeholders.
-
Who is at risk for influenza infection?
When does influenza season occur and is there a peak season?
What is the current resource allocation and is it more necessary?
-
Influenza deaths by geography, time, age, and gender Source: CDC Download Data Set
Population data by geography. Source: US Census Bureau. Download Data Set
Counts of influenza laboratory test results by state (survey) Source: CDC(Fluview). Download Influenza Visits Data Set. Download Lab Tests Data Set
Survey of flu shot rates in children Source: CDC. Download Data Set
Project Date: 2023
Data Management
01. Data Cleaning & Profiling
Each data set was checked for data quality measures and consistency. Identifying bias was a significant step in understanding how best to use this data. Data was then cleaned & and transformed to merged - ready for exploration.
02. Data Exploration
With the clean & merged datasets I looked at identifying trends, patterns, and anomalies within the dataset through statistical summary, visualization, and initial observations.
03. Data Analysis
Here I looked into various statistical tests & hypothesis-testing techniques to extract meaningful insights to address the key research questions. Correlation tests became important in understanding relationships between variables.
Insights & Visualisation
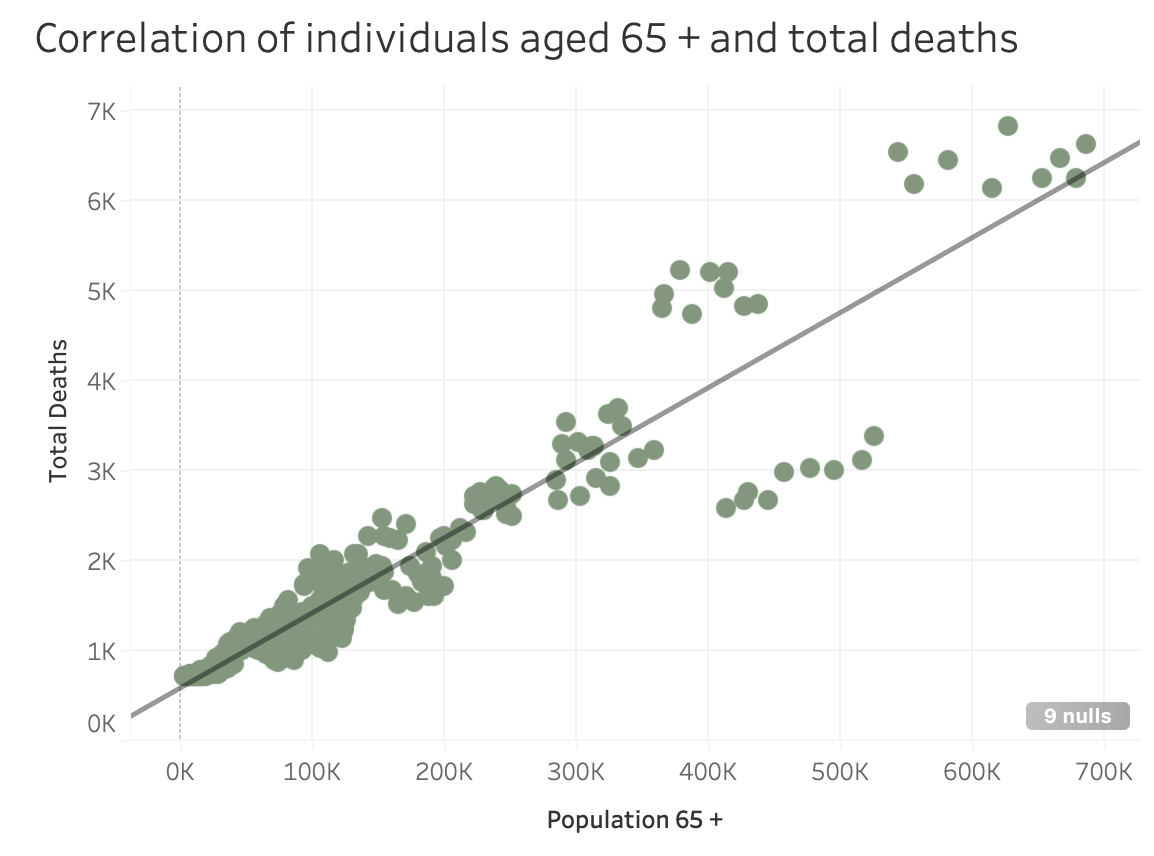
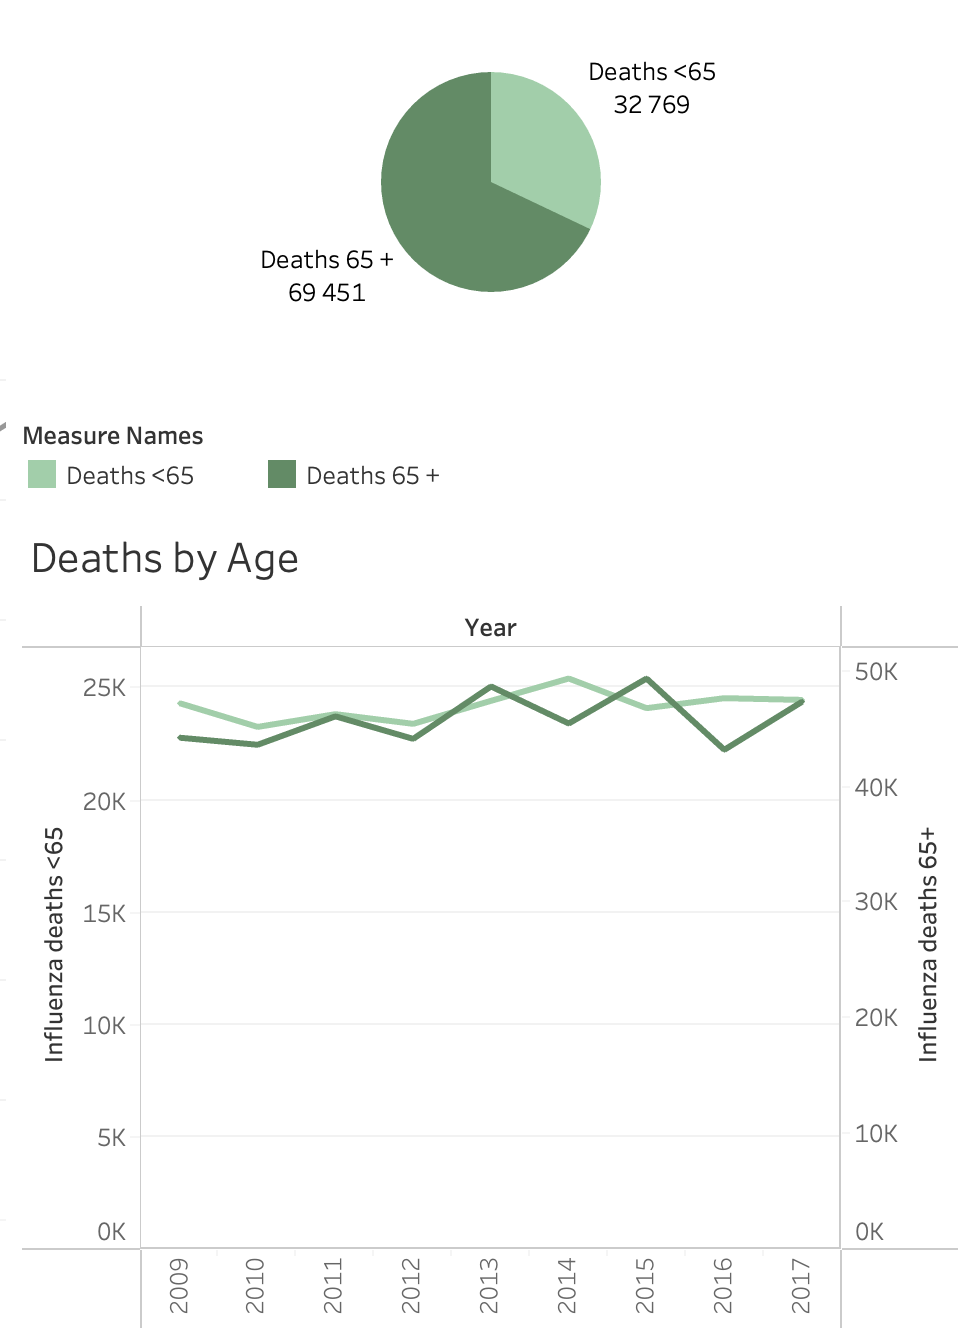
A strong correlation was found between individuals over the age of 65 and total death. We cannot definitively conclude that influenza is the cause of death. In our line chart and a pie chart on the far right one can see that deaths within the vulnerable population (65+) that showed signs of influenza-like illness symptoms were significantly high.
Correlation
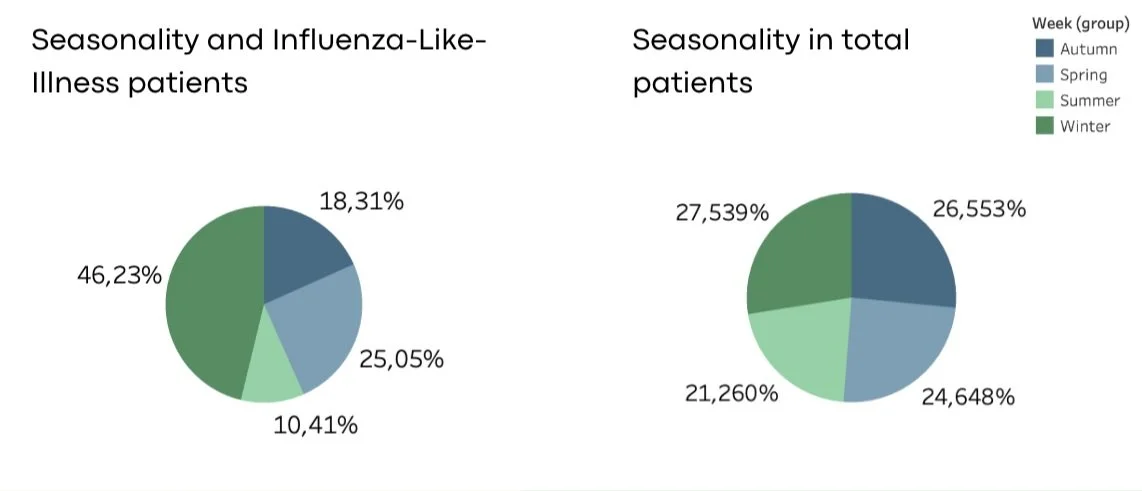
When it comes to the total number of patients visiting a hospital - seasonality does not come into play, however having a look on the left we were able to see that those who have visited the hospital with influenza-like-illness symptoms developed a seasonal pattern.
Seasonality
Concentration of Vulnerable Individuals
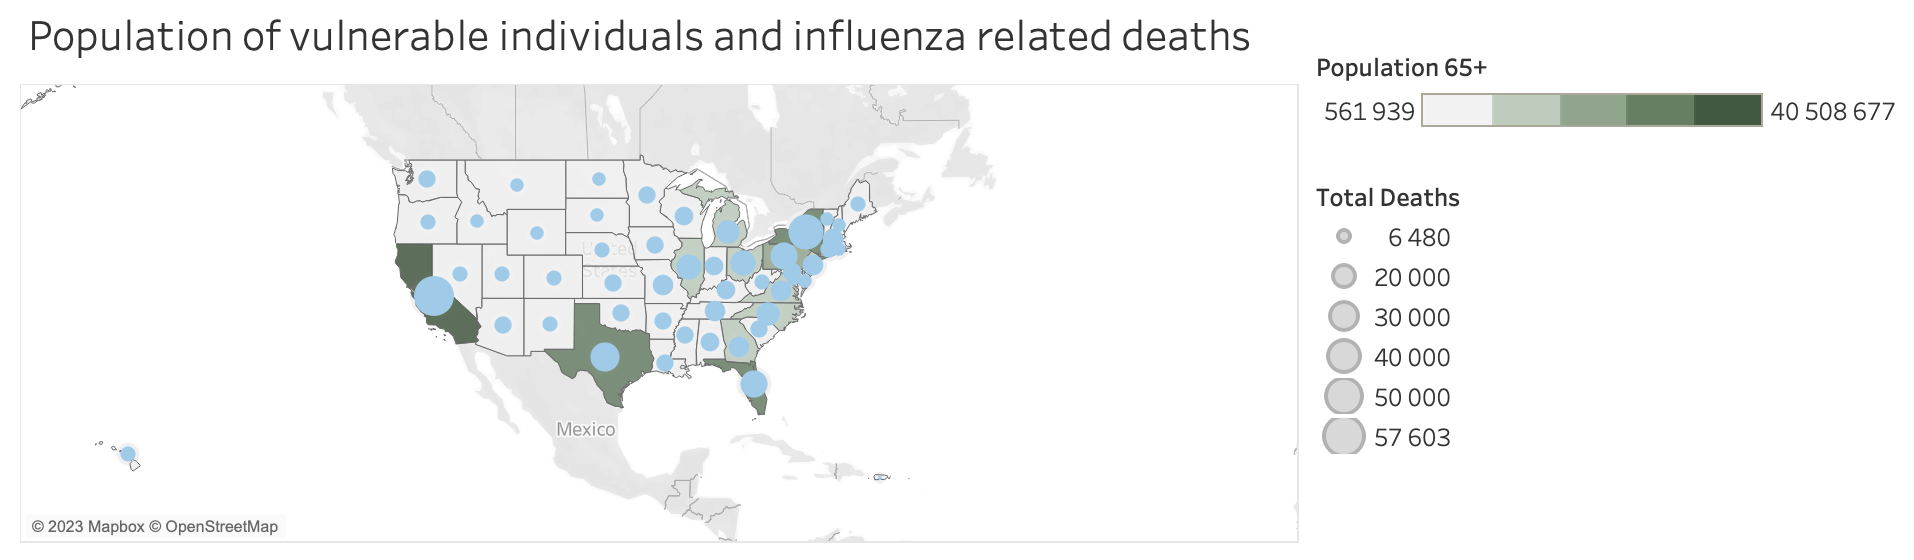
Looking at resource allocation across the US, we can see which areas are more vulnerable to higher death rates and have a larger population of vulnerable individuals. Again, seasonality plays a role - however, forecasting total deaths showed that the trends will be relatively on par with 2016 trends.
Recommendations
-
To provide staffing assistance to the areas where there is a higher concentration of influenza-related deaths, for example, California, New York, Texas & Flordia, Pennsylvania
-
Take Seasonality into consideration amongst the regions of the USA and migrate assistance staff as necessary.
-
Additional factors we could use to look at staffing requirements is the ratio of staff to patients per state. Although this varies for each state, on average we can suggest a 1:5 nurse-to-patient ratio as sufficient.